The vmstat command will provide you a report on the average processes, memory, paging, block IO, traps, disks and CPU activity since the last boot.
Example output:
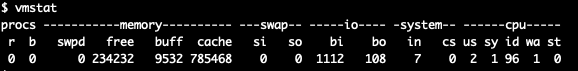
A description for each field:
Procs
r: The number of runnable processes (running or waiting for run time).
b: The number of processes in uninterruptible sleep.

Memory
swpd: the amount of virtual memory used.
free: the amount of idle memory.
buff: the amount of memory used as buffers.
cache: the amount of memory used as cache.
inact: the amount of inactive memory. (-a option)
active: the amount of active memory. (-a option)

Swap
si: Amount of memory swapped in from disk (/s).
so: Amount of memory swapped to disk (/s).

IO
bi: Blocks received from a block device (blocks/s).
bo: Blocks sent to a block device (blocks/s).

System
in: The number of interrupts per second, including the clock.
cs: The number of context switches per second.

CPU
These are percentages of total CPU time.
us: Time spent running non-kernel code. (user time, including nice time)
sy: Time spent running kernel code. (system time)
id: Time spent idle. Prior to Linux 2.5.41, this includes IO-wait time.
wa: Time spent waiting for IO. Prior to Linux 2.5.41, included in idle.
st: Time stolen from a virtual machine. Prior to Linux 2.6.11, unknown.
You can get an updated report every 5 seconds (or your set interval):
vmstat 5
This useful to track the resource usage to help you pinpoint where the resource used: memory, CPU, or disk.
For more information on how to diagnose high server loads:
How to diagnose high server loads
Comments
0 comments
Article is closed for comments.