Explain This RAM Usage?
Running a Cpanel Server on Almalinux 8 with just one Wordpress website. VPS has 2 cores and 3GB RAM. Performance is great! Swappiness is set to 15. MariaDB configuration is typically using not more than 1G of RAM max 99% of the time with occasional brief periods it uses 3GB (according to mysqltuner) so some swap is briefly used on those rare occasions. Every time I run top/htop the system is using about 1.2G RAM, 1.5G is for buff/cache and 200M free. about 650M is allocated in the 2G Swap file.
I just started using Hetrix tools server monitor agent a day ago and I'm perplexed on this graph. The monitor reports once a minute. You can see one of those points where the DB needed more memory (only once in the last 24 hours), at that particular point in time the buff/cache was reduced from 1.5GB to about 0.5GB, swap allocation at the same time when from about 300M to 650M (swap file was resized just a day ago) yet Resident RAM use according to this didn't go up? I would have expected to see Resident RAM use to have risen to closer to 85% RAM with swappiness=15? Looking at this graph there was plenty of free RAM to allocate? I understand swappiness=15 doesn't guarantee it will allocate up to 85% physical RAM, but Max RAM only at 1.3G the whole time?
Seems like a pretty inefficient usage of what little RAM is on the system?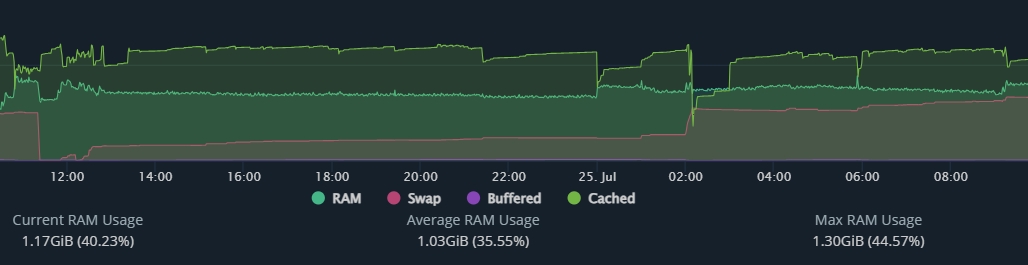
Typical top output:
MiB Mem : 2978.4 total, 139.1 free, 1190.9 used, 1648.5 buff/cache
MiB Swap: 2048.0 total, 1367.8 free, 680.2 used. 1449.7 avail Mem
The spike was the daily WHM account backup running.
mysqltuner output, on most systems, the max possible is typically significantly greater than actual RAM. I try to keep it within 3X. The "actual max reached" is a more clear indicator.
[--] Physical Memory : 2.9G
[--] Max MySQL memory : 8.0G
[--] Other process memory: 0B
[--] Total buffers: 1.7G global + 258.9M per thread (25 max threads)
[--] P_S Max memory usage: 72B
[--] Galera GCache Max memory usage: 0B
[!!] Maximum reached memory usage: 3.0G (102.56% of installed RAM)
[!!] Maximum possible memory usage: 8.0G (276.41% of installed RAM)
-

Hey there! I'm not entirely sure what you're looking to solve here. Are you expecting cPanel tools to use more RAM, or the database system to use more RAM? I am personally a big fan of bumping query cache if you have RAM to burn, as that will only make database queries faster, but if you could get me more details on what you're expecting to happen or what you'd like to change I can likely get you better information.
0 -

I'm trying to solve the issue of the system not making efficient use of the physical RAM. Just trying to figure out why based on the data I have in front of me the system is showing it's never using more than half the physical RAM. There's nothing in the configuration that should be preventing it. Since this is more of a Linux question than a Cpanel question I also posted on a Linux forum.
There isn't a performance issue. One response was the same as my best guess in that the momentary fluctuation in RAM use that causes the swap to increase but doesn't show any increase in physical RAM usage most likely is so brief the 1-minute polling interval of my system monitor doesn't catch it.
Regard query_cache. It is no longer best practice to use it. So much so that it was removed in MySQL 8 and it was deprecated all the way back in MySQL 5.7. This essentially explains why it was removed from MySQL.
I realize I use MariaDB and not MySQL but MariaDB is essentially following suit to an extent. From MariaDB 10.1.7 onwards, query_cache is no longer enabled by default because of the same reasons listed in the article.
0 -
I did see that query_cache was off when I was looking for a default value on my box - thanks for posting some reasons why!
I'm afraid I'm not going to have much good information on my end for this one so maybe the more generic Linux groups might have some ideas.
0
Please sign in to leave a comment.
Comments
3 comments