high httpd consumption

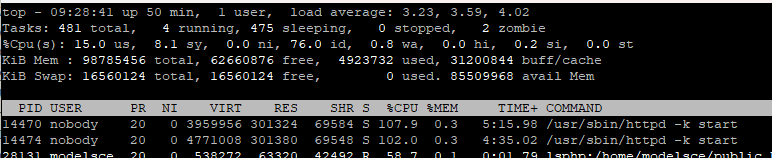
There are 2 processes that are consuming a large amount of processor resources.
How can I determine which processes are consuming processor power? Which script? Or which hosting account?
-

Hey there! I'd recommend starting here:
https://support.cpanel.net/hc/en-us/articles/360056001894-How-to-diagnose-high-server-loads
as there is an Apache section about halfway down the page that should get you pointed in the right direction.
0 -
You can map those hot
httpdPIDs to the exact vhost and request in a few minutes.1) See which vhost/URL each
httpdworker is serving-
In WHM » Server Status » Apache Status you’ll get a live table (PID, VHost, Request, Client, CPU).
-
If it’s empty, enable it:
-
WHM » Service Configuration » Apache Configuration » Global Configuration → set ExtendedStatus = On.
-
Optional (CLI/localhost view): add an include to allow only localhost:
<Location /server-status>
  SetHandler server-status
  Require local
</Location>
Then on the server:
curl -s http://127.0.0.1/server-status?refresh=1Find your PIDs (e.g. 14470, 14474) and you’ll see VHost and Request.
-
2) Identify the hosting account and script
-
On most cPanel EA4 setups, PHP runs via PHP-FPM per user. Check which pool is burning CPU:
ps -C "php-fpm" -o pid,user,pcpu,pmem,command --sort=-pcpu | headThe user column is the cPanel username/pool responsible.
-
Correlate with logs to see the hotspot:
# Top IPs hitting the server now
awk '{print $1}' /usr/local/apache/domlogs/* | sort | uniq -c | sort -nr | head

# Hot URLs (all domains)
grep -hE 'GET|POST' /usr/local/apache/domlogs/* \
  | awk '{print $7}' | sort | uniq -c | sort -nr | head
If it’s one domain, use its log in
/usr/local/apache/domlogs/DOMAIN.
3) Quick mitigations while you investigate
-
If it’s a couple of abusive IPs, block temporarily at the firewall or web server.
-
If it’s an app endpoint (e.g.,
wp-login.php,search,wp-json), enable caching/rate-limit, tighten auth, and ensure ModSecurity is on. -
If CPU is in PHP, review that account’s PHP-FPM pool (
pm.max_children, opcache) and app caching.
In short: Apache Status (ExtendedStatus On) tells you which vhost + URL each hot PID is serving; php-fpm process list tells you which cPanel user is actually consuming CPU. The access logs confirm the exact path and traffic source.
If you share the
server-statusrow for those PIDs (VHost/Request/Client) or the top lines from the domlog, we can point to the specific fix.0 -
Please sign in to leave a comment.
Comments
2 comments